The Rising Clout of the “Blue Collar” Workforce

Since at least the 1970s, most Americans were brought up believing “white collar” jobs were preferable to “blue collar” jobs. This became so ingrained that many parents who held good blue-collar jobs wanted “better” for their children.

This was institutionalized in the late 1970s when liberal educators remolded our entire K-12 education system around the college preparatory track. The stated purpose was to prepare every student for college enrollment. The entire curriculum was rebuilt with this objective.

It is as if those in charge felt we no longer needed to prepare our kids for careers as factory floor workers, hairdressers, welders, waiters, sales clerks, or all the other trades that make up well more than half of our workforce.

Because of the elevated status of college degrees, many jobs that could be accomplished with far less formal training started to require a degree. This in turn led to a dramatic increase in college enrollment, college costs, and student debt.
Source: United States Bureau of Labor Statistics, GIS Reports

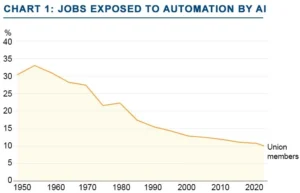
During this same period, there was a dramatic decline in union workers. See Chart 1. In the first half of the last century, it was the unionization of the blue-collar labor force – particularly in manufacturing – that provided wages and benefits that often exceeded those of many of the white-collar workers of that day.

The decline in private sector unions is closely tied to the decline in manufacturing employment. In the late 1940s, manufacturing accounted for 32% of all jobs compared to 8.5% today. Many of those remaining manufacturing jobs migrated to “right to work” states in the south. Employers in these states had much more flexibility in setting pay and benefits.

In the more recent decades, globalization and technology have also had a profound impact on the decline in U.S. manufacturing jobs. Private sector unions fought rearguard actions to preserve as many jobs as possible with pay packages that would not accelerate the union’s decline.

This multi-decade cycle of the ascendance of white-collar work over blue-collar work may be over. The pandemic shined a bright light on the so-called everyday people without whom life crawls to a standstill.

Private unions appear to be in the ascendancy as qualified blue-collar workers, after years of neglect, have become scarce! The recently passed legislation to boost infrastructure and manufacturing within the U.S. has run into this roadblock. For example, Taiwan Semiconductor had to push back plans for their new facilities outside of Phoenix citing a lack of skilled workers to build the facilities.

In addition, private unions have won major new concessions this year in a wide variety of companies and industries including UPS, longshoremen, and the airlines. The current UAW strike reflects new extremes in union demands.

Many companies such as Target, Amazon, and Kroger have seen the writing on the wall and have voluntarily raised wages dramatically. Virtually all frontline workers have received much more recognition and pay since the onset of the pandemic.

At the same time, white-collar workers may be going the opposite direction. The Challenger Report tracks all layoffs in the U.S. Recently it reported that we may be facing the first ever “white-collar recession”. They noted that most layoffs this past year have been among white-collar employees.
Source: The Wall Street Journal, Goldman Sachs Global Investment Research

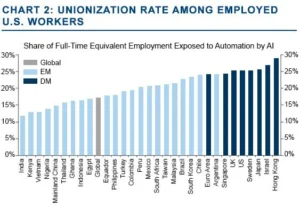
Research from Goldman Sachs suggests that 25% of American jobs could be automated by AI, compared to approximately 18% globally. See Chart 2. A very high percentage of these lost jobs will be from white-collar employment. Whereas there is no AI replacement for your electrician, plumber, mechanic, delivery person, etc, those that work with and distribute data are much easier to replace.
The Major Forces Molding Our Future

Daily changes within our economy are imperceptibly small except in highly unusual circumstances like the impact of Covid. Yet our economy is always in a state of change, driven by powerful long-term economic forces.

Today, the dominant factors steering our economy are demographics, social strains, government policies/debt, geopolitical realignment, technology, and climate change. These forces will shape our future.

Source: Yardeni Research, Inc.
Source: The WSJ, OECD & Moody’s Investor Service, Chart: Axios Visuals

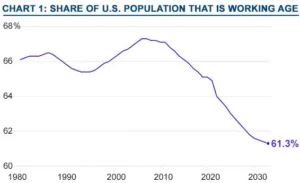
Demographics. The world population is getting older as people live longer and have fewer children. The decline in the (traditional) working age population will continue. See Chart 1. Without a pickup in productivity, economic growth will slow, and standards of living will stagnate.

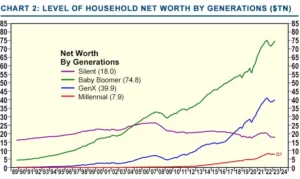
Social Strains. For much of the past three decades a disproportionate amount of income and wealth creation went to a smaller percentage of people, particularly those with capital in either the private or public markets. Most of today’s wealth resides within the Boomer generation (and this is concentrated in the wealthiest 10%). See Chart 2. Also, low income wages stagnated as many jobs moved offshore while minimum wages barely budged. This has strained social cohesion.


Government Policies/Debt. Government spending has skyrocketed. Given the flood of new money coming from the Infrastructure, Chips, and Clean Energy bills (on top of Entitlements and Defense increases), it is not likely to fall off. And of course, so much of it is borrowed (deficit spending) that the interest bill to the Federal government is soaring.

Geopolitical Realignment. Francis Fukuyama’s The End of History in 1989 suggested that after the fall of communism, Western liberal democracy had “won” and may be regarded as the final evolution of human government. For a time, this notion gained wide acceptance. Yet history did not end and there has been a rapidly growing divergence between liberal democracies and autocratic governments, particularly since Xi Jinping became president of China.

Technology. Advancements in technology over the past several decades have irrevocably changed the way we live and work. From the personal computer to the internet, email, smart phones, Zoom, and on and on. Now we are told that AI (artificial intelligence) will change our world even more dramatically than its precursors and at a faster pace.

Climate Change. Climate change is real although the causes extend far beyond fossil fuels. For example, just the increase in carbon dioxide from California’s 2020 wildfires was estimated in Environmental Pollution (10/22) to be twice the total of all California’s reductions over 15 years.

How might these disparate trends interact to mold our future?

Efficiency to Resilience. This is the force behind reshoring and increased defense budgets. Interest rates will be higher, inflation will likely be higher too as we turn from free markets and free trade toward industrial policies and managed trade. In addition, the impact of weather events – flooding, wind damage, extreme heat, droughts – will take ever greater resources just to fortify what is in place. This implies higher inflation and higher interest rates than we recently enjoyed.

Reductions in Inequality. Entitlement reform is essential if we are to pay for the increased demands on government. (Reduction in benefits to the wealthy and higher paid will be necessary.)

Wages will likely continue to rise across the bottom half of the income spectrum as a shrinking workforce increases labor’s bargaining power. Income taxes are likely to be even more progressive along with higher estate transfer costs.

New Global Powers. China may “hollow out” as it suffers from a rapidly aging workforce (a result of the one-child policy) along with the rise in capital flight and out migration by some of the wealthiest and brightest. The Middle East and Africa are likely to gain increasing power due to younger demographics and commodity wealth. India should benefit from its young, tech savvy workforce.

AI, the Wild Card. While many worry about a tragic Terminator type of outcome, there is real promise in areas like education, health care, and routine back-office services. If we are to have the long-awaited productivity boom, this will be the source.

Interest Rates, Credit, and Climate Change

The earth’s climate has changed many times over its history from bitter ice ages to much warmer periods. One statistical relationship holds true through all these periods, the higher the temperature, the less ice in the arctics and the higher the ocean level. So one variable, temperature, changes the configuration of all land masses.

The level of interest rates plays a similar role throughout the economy and the markets. Higher or lower interest rates change the entire financial landscape.

Almost all lending rates are tied to the Fed Funds Rate, the rate for overnight lending by the Federal Reserve (Fed). One example of direct ties are margin loans for our clients at Schwab which are often quoted at 2.0% plus the Fed Funds Rate. An example of indirect ties are 30-year fixed mortgage rates which have no direct ties to the Fed Funds Rate, but have sharply risen for borrowers.

Source: The Wall Street Journal

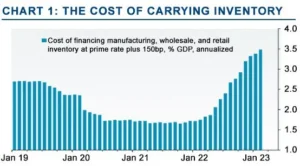
Carrying Costs. Higher interest rates raise the carrying cost of anything bought with credit… homes, automobiles, commercial buildings, capital equipment, inventories and so forth. See Chart 1.

As rates go up, fewer things are either affordable or make economic sense thus dampening economic growth. For example, a new business expansion that made good sense when the prime rate was 3.0% no longer works with its current 8.0% rate.

Less growth means less demand for goods and services which reduces inflation. This was the stated goal of the Fed as it raised the Fed Funds Rate over the past 12 months from effectively zero to now 4.75%-5.0%. It is working as inflation has steadily declined.

Housing is a good example. Home sales plummeted in 2022. As a result, the average home price came down (over 12 months) for the first time since the financial crisis. The ripple effects of less new housing are extensive – appliances, landscaping, furniture, and much more, all rise or fall with the housing industry.

Rollover Costs. After a decade of extremely low interest rates, most individuals and companies had financed their debts at very low interest cost, whether that be mortgages, bond issues, or virtually any other type of loan.

After the steep rise in interest rates over the past year, any debt that comes due, and needs to be rolled over, will jump to a much higher rate. This will reduce the cash available for other purchases, salaries, or capital investment.

Source: Haver Analytics, Rosenberg Research

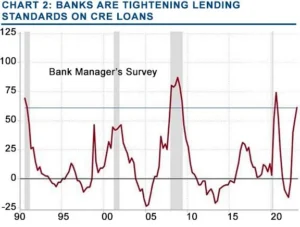
Commercial Real Estate (CRE) will have its highest dollar amount of rollovers in a generation this year. Already, major property owners such as PIMCO and Brookfield have walked away from properties they owned. Obviously, there will be more foreclosures and bankruptcies ahead. Banks will also be much more hesitant to rollover CRE loans. See Chart 2.

Hurdle Rates. Higher interest rates directly impact the risk/reward equation within investment choices. The higher the rate on “risk free” money market accounts, the more serious the competition (hurdle rate) they offer to other investments. Less risk taking by investors means less investment in economic activity.

Portfolio Declines. As the yields on newly issued bonds rise, the market value of previously issued bonds fall. It does not matter whether the bonds are super “safe” U.S. Treasury bonds, corporate bonds, mortgages, or municipals. This is what caused 2022 to be an especially bad year for virtually all bond investors.

Summary. The higher costs of carry and rollovers, as well as foreclosures, mostly occur when loans mature or new projects are deferred. This is why raising interest rates has a lagged impact of 6-12 months on economic activity. Even if the Fed is close to – or even at – the end of its rate rising, the impact of today’s rates will continue to slow the economy throughout 2023.

Fortunately, most of the economic impact is from the interest rate itself, not from the credit quality of the borrowers or the underlying investments. This means that as interest rates come down, much of the constrained economic activity can resume. The question then becomes, when does the Fed believe its inflation objective is achieved enough that it can begin that process.

What Is Behind Sustainable Progress?

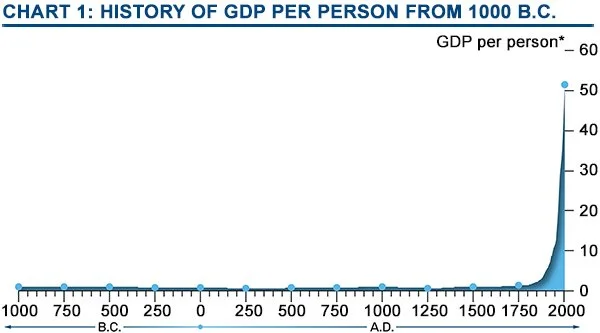
Between 1000 BC and 1750 AD the Bank of England estimates that the average person’s standard of living no more than doubled. That is little advancement over almost 3,000 years. Yet they estimate that from 1750 to today, the average has gone up over seven-fold. (Changes in standard of living are closely aligned with GDP per person.) See Chart 1.

The massive change in living standards that occurred over a handful of generations is nothing short of a miracle. Most Americans today live better and longer than the wealthiest kings of a few hundred years ago.

We owe this magnificent change in human history to the advancements in math, science, physics, and medicine that laid the groundwork for the steam engine, telegraph, railroad, electricity, automobile, telephone, vaccines, aircraft, automation, software, the internet, smart phone, cloud computing, and so much more.

Source: Bank of England

These are the more visible signposts that have been hallmarks of this age. However, there is much more to this story. Isaac Newton wrote in 1675, “If I have seen further (than others), it is by standing on the shoulders of giants.” In other words, each new bit of knowledge, each invention, is possible because of what has come before.

Much of the groundwork in basic sciences and math including geometry, astronomy, physics, and philosophy, was developed during Newton’s Age of Enlightenment. This was a period that saw the development of basic inventions necessary to our modern economy such as Gutenberg’s printing press.

Yet standards of living barely budged in this period. So, what was the “secret sauce” that unleashed the phenomenal economic growth of the past 250+ years in the Western world?

Two organizing concepts changed the world, democracy, and capitalism! Capitalism supplanted mercantilism as the basic economic model in England, Europe and particularly the United States, as spelled out in Adam Smith’s Wealth of Nations in 1776 … the same year of our independence. Mercantilism assumes a fixed economic pie (which meant you only grew more prosperous by taking someone else’s riches) while capitalism grows the economic pie and spreads it more broadly within the population.

Our new country’s inspired leaders, not burdened with the yokes of history, had the freedom to take from the best thinking of the giants who had come before. They delivered a true democracy – divided government, elected leaders, rule of law, an independent judiciary and Bill of Rights.

They encouraged free markets and the private ownership of land and inventions.

Alex de Tocqueville, the French sociologist and author, traveled widely throughout the United States in 1830 and 1831. The results of his travels and countless interviews led to his insightful masterpiece, Democracy in America (1835). Among its many revelations to Europeans (and Americans) was the individualism, freedom, and equality that Americans deeply believed in.

One insight that set America apart from virtually every other culture to this day was the trust Americans held in their fellow Americans. This supported the vast network of community, state, and federal associations as well as political, social, and economic structures thriving in America. Americans also exhibited tremendous depth of belief in their country and were willing to risk their lives in support of these beliefs. This was the basis of American Exceptionalism.

All of this went rushing through my mind as I watched Ukrainian President Volodymyr Zelensky address our Congress – in person – on the 21st of December. Here is a man leading a nation with such conviction, such belief, such courage, in the fight for the freedom of democracy and self-rule. The standing ovation given by Congress was not by party affiliation but by recognition of the continuing fight for principles.

Authoritarian rulers come and go, but little of lasting value comes from them. They coerce, bully, or bribe allegiance to themselves, not to principles. They typically drape themselves in the egalitarian promise of socialism or communism. In the end they often leave their country either backward or in ruin as seen in the rule by such strongmen as Stalin, Hitler, Mao, Castro, Maduro, and now Putin. Will Chairman Xi be next?

The turn to democracy and capitalism in the Western world underwrote the sustained progress of the past 250 years. But as shown by the unbelievable courage and will of the Ukrainian people, it should not be taken for granted.

Disclosures

“Money Has to Be Somewhere”

I find myself using this phrase often lately. Whether it is in stocks, bonds, investment real estate, money market accounts, gold, cryptos, or cash under the mattress… money must be somewhere. The concept of “money” is more of an accounting mechanism for balance sheets and income statements.

Every choice has its own characteristics which include:

  • Upside potential (moonshot or steady eddy)

  • Downside risk (erosion or wipeout)

  • Liquidity (ease of selling at the current estimate of value)

As most clients know, I did extensive research on asset class performance in the late 1980s. I developed our proprietary Historical Risk/Reward Charts as a way of comparing the risks and rewards of each investable asset class to each other.

With this analysis in hand, I developed “ideal” asset allocations to meet the wide variety of investor objectives which were first presented in 1990.

Our Historical Risk/Reward Charts are updated annually to present up-to-date guidelines as to the risk and reward of each asset class and asset allocation since 1972. Within each Historical Risk/Reward Chart:

Risk is defined as the percentage decline during bear markets (such as the one we are in today) as well as the length of time the portfolio was “underwater” (the total months of decline plus the total months to full recovery).

Reward is defined as the average annual return the portfolio delivered above the annualized riskless rate of 30-day Treasury bills for the same period.

Source: Tanglewood Total Wealth Management-Charts available on request.

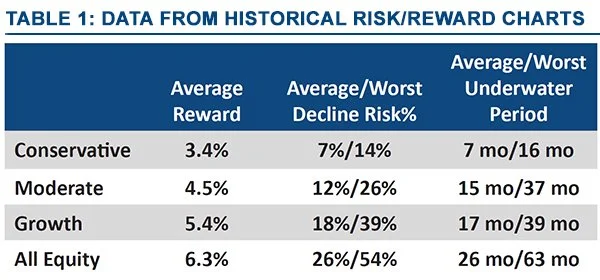
Table 1 shows the risks and rewards of Tanglewood’s four primary Investment Policies (IPs) as shown in their most recent Historical Risk/Reward charts (1972-2021). (A copy of these charts are provided in each client’s Tanglewood/Black Diamond Portal.)

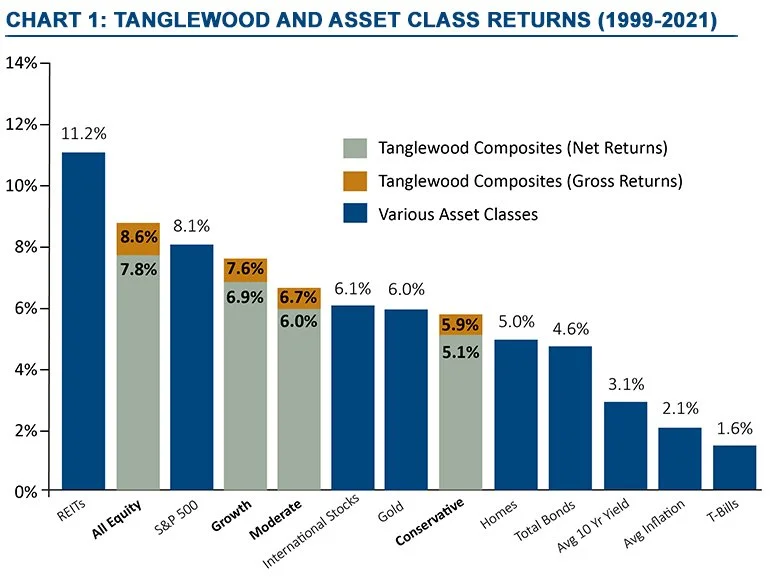
Chart 1 contains both asset class and Tanglewood IP composite performance for the period 1/1/99 through 12/31/21. This is not an arbitrary period, 1999 is the first year that Tanglewood’s performance was audited in accordance with GIPS standards. Both gross and net returns are shown for our four primary IPs — Conservative, Moderate, Growth and All Equity. Expanded performance information is provided on page 11.

Our performance calculations were verified over 17 years before dropping the audit in 2017 due to its increasing cost. However, we continued to follow the same procedures in calculating performances. We recently made the decision to resume our outside audits which will begin with where we previously stopped.

Source: Federal Reserve Economic Data (FRED), Tanglewood Total Wealth Management, Inc.

Money has to be somewhere and the asset classes in Chart 1 are the primary portfolio choices. This provides an excellent backdrop for our performance.

A very important confirmation of Tanglewood’s performance relative to that predicted by our Historical Risk/Reward Charts can be derived from the chart. The rewards of Tanglewood’s net returns over this period are almost identical to the rewards shown in Table 2. We delivered the expected returns over this period net of all fees and costs.

For example, Tanglewood’s Conservative indexed benchmark shows an annual reward of 3.4% since 1972 (Table 2). Since 1999, Tanglewood’s actual Conservative composite has provided a reward of 3.5% (Conservative’s 5.1% net average annual return is 3.5% greater than the average 1.6% return from treasury bills over this period.) Tanglewood’s Moderate, Growth and All Equity composites are equally close to those of their expected returns.

Disclosures

Declines, Losses, and the Path of Travel

There is a big difference between a “loss” from investments and a “decline” in current market value. Yet while a portfolio is experiencing a steep drop, like the one during the first half of this year, they both may feel the same.

I define a loss as a permanent impairment of market value whereas a decline is a lower market value that is temporary and fully recovered within a reasonable period. A portfolio loss often requires a change in lifestyle or a reduction of (anticipated) spendable income. A portfolio decline should require no adjustment to current plans.

One of the characteristics that often distinguishes the two is diversification. For example, owning one real property is subject to many local considerations, all of which can change and become more detrimental. Many single properties have experienced permanent losses in value over time.

Source: The WSJ, Market Tools, Value Square Asset Mgmt, Yale University

On the other hand, owning a portfolio of real properties that includes many property types (apartment, office, retail, self-storage, etc.) – particularly if over several geographic areas — has rarely led to permanent loss unless excessive debt was used to purchase the properties.

This leads to a second source of losses, leverage. Many a worthwhile investment has turned into a loss for the holder because of too much debt on the asset. Leverage is a double-edged sword. It enhances returns during good times but can destroy them in down cycles. Limiting or avoiding leverage may be the single best way to avoid a permanent loss.

Owning the total U.S. stock market, despite its periodic declines, has provided enviable long-term returns, averaging roughly a 6% annualized return above inflation in every 35 year period over the past two centuries according to Jeremy Siegel’s Stocks for the Long Run.

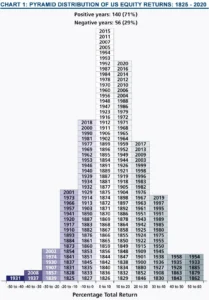
Chart 1 illustrates the U.S. stock market’s annual returns from 1825 through 2020. The annual returns are categorized by ten percent increments. For example, on the bottom left of the chart is the year 1931 over the -50% to -40%. This indicates that it is the only year with an annual decline greater than 40%. There are only two additional years (out of 196) that had declines greater than 30%. The year 2008 was one of them which shows how brutal the Financial Crisis was while one was in it.

If the total U.S. stock market ends 2022 where it was at its recent low, down 23%, it would be only the seventh year out of the 196 in the -20% to -30% category.

As shown on the chart, the market has provided a positive return in seven out of every ten years, and a negative return the other three. Almost the same percentage has held true in this century through 2020. There have been five down years and sixteen up years.

Taking it one step further, portfolios built around professionally researched asset allocations can be tailored to limit the degree of decline during major bear markets.

Asset allocation makes further use of diversification by using multiple asset classes. This is what our Investment Policies have accomplished in the real world of investing for 32 years.

One final way of looking at market declines is through the path of travel. The total U.S. stock market was virtually the same price in late November of 2020 as it was at the end of June 2022. However, this price was at an all-time high back then. From November 2020, the market continued to climb reaching its cycle high at the very beginning of this year. Since then it has retraced those additional gains back to the November 2020 price.

Everyone was more than delighted with today’s price just a year and-a- half ago. If the market had declined first (after that November 2020 high), and then recovered back to today’s price, most investors would be ecstatic today…and yet it is the same price. The difference is only how we got here. For our perception, the path of travel is often more important than the price.

The End of Globalization…Again

It took a pandemic, war, and surging inflation to end the great age of globalization…105 years ago.

Source: The Wall Street Journal, Fouquin and Hugot (CEPII 2016), Goldman Sachs GIR

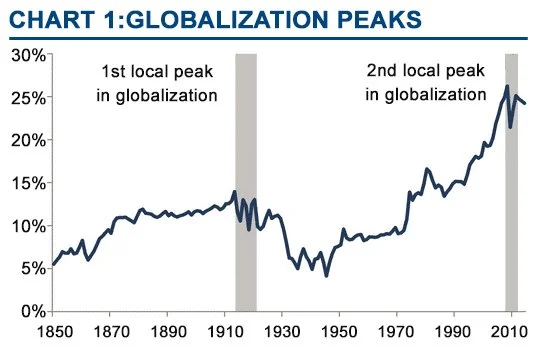
The first modern age of globalization was the period between the 1850s and WWI. This was an exciting period when business leaders like J.P. Morgan, Andrew Carnegie, and Cornelius Vanderbilt connected America and the world with networks of steamships, railroads, and telegraphs. See Chart 1.

Leading economists of the day proclaimed war was “obsolete” because of the interdependence between countries that these businesses developed. Those economists were wrong, WWI brought a decisive end to that era of globalization.

The foundations of globalization were set out by Adam Smith in his famous Wealth of Nations (1776). His notion that through trade, each country should provide the rest of the world with what it does best, where it had inherent advantages of natural resources, unique talent or manufacturing prowess.

His ideas upended the historical economic model known as mercantilism, the principle of a fixed total value of global wealth (i.e. pie). The only way for one country to get a bigger slice was to take it by force. Thus, the incessant wars since time began.

Adam Smith’s capitalism provided another way…grow the pie…make each country richer without war. Globalization embodies the ideals of capitalism for all participating countries. But globalization requires rules of the road that are fair and respected by all.

This did not happen between the two World Wars. Nationalism and communism took center stage, beggar thy neighbor policies took root, and ruthless dictators rose to power.

Globalization did not pick up again until the formation of the United Nations and the General Agreement on Tariffs and Trade (GATT) in the aftermath of WWII. At first, globalization was only among the non-communist nations of the West. Despots such as Mao Zedong and Joseph Stalin continued the cruel subjugation of their peoples in the East.

This began to change with Deng Xiaoping’s new direction for China (1978) and the fall of the Berlin Wall (1989). Capitalism had defeated communism as an economic model! This brought these new entrants to enjoy its benefits.

For several decades this new era of globalization blossomed. Countries like Germany fully bought in, putting international business connections well above any security concerns. They were not alone as businesses in most participating countries benefitted from the lower material and labor costs that globalization provided.

The inter dependencies of this era of globalization far exceed those of the prior one. Computers, the internet, container ships, air travel, and education have integrated businesses at countless points. Relationships such as “just in time inventories” were born. Most business elites (the Davos men) have presumed that “this time, major wars must be obsolete.”

Yet one thing is clear from both the earlier period as well as the current one…in the end, political forces trump business connections. Political rivalries (hegemon) and yearning for past glories have given birth to authoritarian leaders who cast aside the former business elites in favor of their own agendas — Vladimir Putin in Russia and Xi Jinping in China.

Such bullies often get their way until some breaking point is reached, when the rest of the world finally responds…as with Ukraine, today. “The Russian invasion of Ukraine has put an end to the globalization we have known for the past three decades,” wrote Larry Fink, the CEO of Blackrock. This is notable as he has been perhaps the best-known cheerleader of globalization.

The world is breaking up into several “blocks” — the West (democracies, rule of law, independent judiciaries), the East (authoritarian, controlled media), and Non-Aligned (those with some features of each, trying to play both sides).

I believe strongly that the western principles will prove more resilient in the face of this new “competition” …just as capitalism won the Cold War. The people of Ukraine have demonstrated overwhelmingly that freedom, once achieved, is not something people give up lightly.

Opportunities within the West (potentially a new League of Democracies) are endless as this is where innovation thrives and people are free to make their own choices.

Disclosures