Markets
Markets | July 2024 Quarterly Markets Overview & Outlook
John Merrill, Brian Merrill, Curtis Holden, Tom Bruce, July 2024
OVERVIEW.
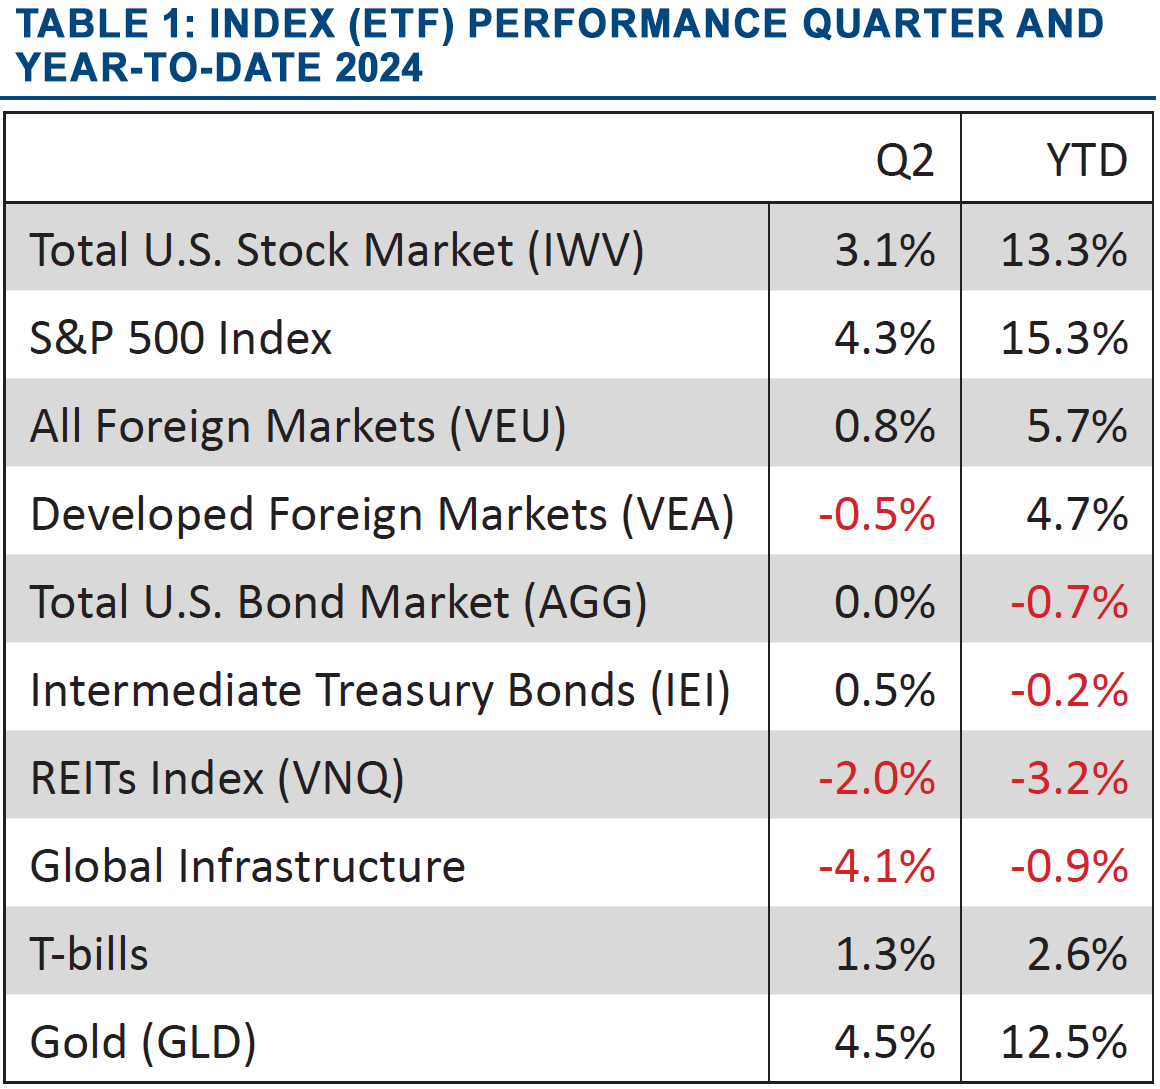
U.S. stocks and gold were outstanding performers in the second quarter (Q2) and for the year-to-date (YTD). International stocks lagged badly in Q2 and consequently for the year. Interest sensitive asset classes (bonds, REITs, and infrastructure) were flat to down in both periods. See Table 1.
Domestic Stocks.
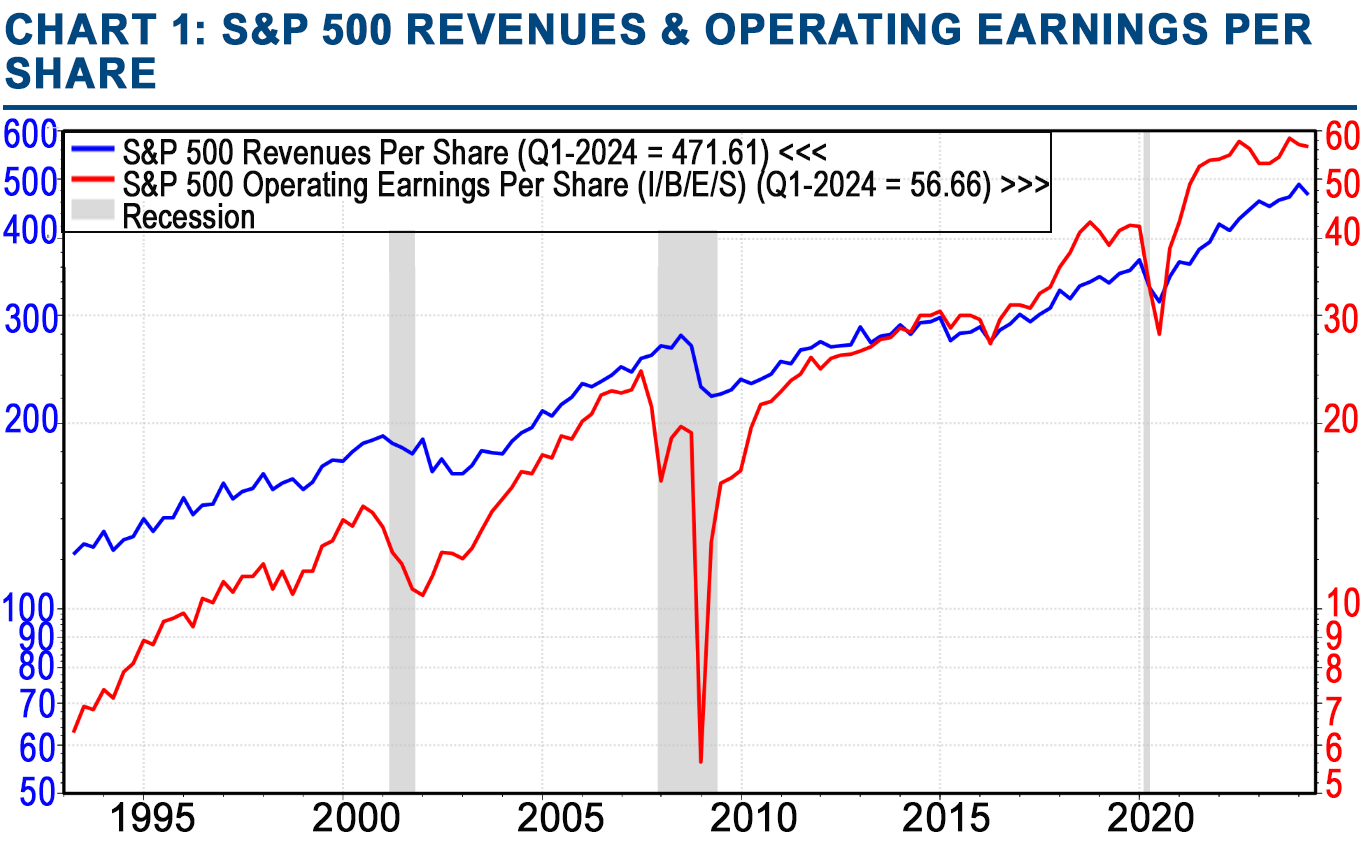
U.S. companies have benefited from the strong economy and accompanying rising revenues. They have also demonstrated they are managing their costs effectively with rising operating earnings. This growth in both revenue and profits raised investor confidence, driving further stock price appreciation. See Chart 1.
Controlling labor costs has been a major factor behind improving corporate margins and profit growth.
It helps that the labor market has been rebalancing with supply and demand reaching a more sustainable equilibrium.
Source: Morningstar
Source: LSEG DataStream, Standard & Poor's, and @ Yardeni Research
The labor market rebalancing, in combination with a major jump in technology investment, has allowed companies to produce more with fewer employees (higher productivity). This is behind the steep decline in the growth of unit labor costs as shown on Chart 2.
Whereas the major market indexes produced outstanding returns, there were huge disparities under the surface. The S&P 500 closed the quarter up 4.3%, but this was largely from the stellar performance of a handful of dominant stocks, the much discussed Magnificent 7 stocks.
These stocks have been the primary driver of domestic stock returns over the entire bull market. They actually widened the gap between themselves and the rest of the S&P 500 this past quarter. See Chart 3.
This is an extreme case of poor “breadth”, when a small number of stocks drive the majority of market gains while the broader market significantly underperforms. Market history suggests narrow markets are weaker and more prone to corrections than bull markets that have wide participation.
Source: Haver Analytics, BLS, Rosenberg Research
Source: Bloomberg, Apollo Chief Economist
This divergence can also be seen by the much wider than normal performance differential between the Total U.S. stock market (roughly 3,000 stocks) and the S&P 500 index with its much larger allocation to the Magnificent 7 stocks. See Table 1.
Such narrow leadership has raised concern from many market observers with some making comparisons to the infamous 1990s Dot Com bubble.
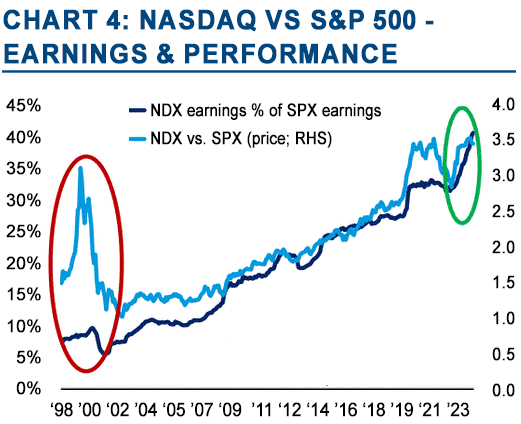
Yet in reviewing the market now versus the Dot Com bubble, there are some important differences. The companies behind the advances in technology today have delivered profit growth in line with stock price increases...particularly the Magnificent 7.
Source: Bloomberg, Apollo Chief Economist
This is quite different from the Dot Com bubble when prices clearly moved far above anything the fundamentals could justify. See Chart 4.
Looking ahead, the market may well broaden out in the back half of this year and next year. FactSet, which aggregates analysts’ earnings estimates, reports that the earnings for the S&P 500 are estimated to grow 11% this year with all but two sectors contributing. For 2025, they estimate 14% growth with all sectors contributing.
The improvements in corporate profits supported by a solid economy, strong productivity, and the expectation of easier monetary policy ahead supports the case for the continuation of the bull market.
International Stocks.
While U.S. stocks have soared to new heights, most international markets have lagged well behind. Not only do they lack America's leading tech giants, but most also lack our "dominant ecosystems" discussed in the Economy Section.
Europe is additionally suffering from a lack of R&D spending and energy costs that approach five times that of the U.S.. These are undercutting the competitiveness of their leading manufacturers. Germany’s Dax index is up by about half that of the S&P 500 this year while France’s CAC 225 index was marginally lower in the first half.
Domestic Fixed-Income.
Cash (higher yielding money market accounts) was again the leader among the high-quality fixed income asset classes.
The yields on these money market accounts closely follow the Fed’s lead in setting interest rates. In other words, the yield on money market accounts rises and falls based on the current Fed policy rate.
The Fed raised rates dramatically from early 2022 through July of last year. The last rate setting was to a range of 5.25% to 5.5% which has been stable for the past year.
Given the decline in inflation over this period, many observers thought the Fed would have already begun to lower their policy rate. However, as noted in the Economy Section, they want clear and consistent proof that inflation is returning all the way to their 2% target before even beginning to reduce rates.
Investors in high-quality domestic bonds have paid a price this year for the Fed’s reticence to lower the front-end rate. U.S. Treasury bond yields have risen across the maturity curve.
The benchmark 10-year Treasury bond began the year with a yield of 3.86% but ended Q2 at 4.39%. While the higher rate is better for long-term bond investors, the consequent decline in bond prices offset the entire yield in the first half resulting in slight total return decline. See more on this in the Strategies Section.
Bond investors are now unsure as to where inflation, the Fed policy rate, and bond yields will ultimately settle.
Real Assets.
Real estate and infrastructure struggled in Q2. Unlike home mortgages, commercial real estate loans have shorter loan periods and need to be refinanced more frequently. Loans that were originated at low interest rates are now coming due. See Chart 5. The new higher interest rates threaten to overwhelm some borrowers.
Until now, many lenders and borrowers postponed dealing with loans coming due through an “extend and pretend” approach. However, the uncertainty of the timing of future rate cuts by the Fed is forcing many commercial real estate lenders – particularly small and medium size banks – to renegotiate these loans as they come due. This will substantially reduce the profitability of many of these projects and force some into bankruptcy.
Gold.
Gold rose 4.5% in the quarter, driven by purchases from central banks like China and Russia. However, the People’s Bank of China did not buy gold in May, which coincided with a pause in gold’s rally.
Source: CRED iQ, MBASource: CRED iQ, MBA
Source: The Wall Street Journal
As an inflation hedge, gold has been very similar to long-term U.S. Treasury Inflation Protected Securities (TIPS). Neither distributes income and both are perceived to be (almost) risk-free. Chart 6 shows how correlated their prices were until the Russian invasion of Ukraine.
As opposed to simply being an inflation hedge, the price of gold is driven more today by geopolitical tensions and the resulting desire by authoritarian countries to diversify away from the U.S. Dollar.


