
Founders Perspctive
Explore: Wealth Planning Founder’s Perspectives Books

Declines, Losses, and the Path of Travel
John Merrill, July 2022
There is a big difference between a “loss” from investments and a “decline” in current market value. Yet while a portfolio is experiencing a steep drop, like the one during the first half of this year, they both may feel the same.
I define a loss as a permanent impairment of market value whereas a decline is a lower market value that is temporary and fully recovered within a reasonable period. A portfolio loss often requires a change in lifestyle or a reduction of (anticipated) spendable income. A portfolio decline should require no adjustment to current plans.
One of the characteristics that often distinguishes the two is diversification. For example, owning one real property is subject to many local considerations, all of which can change and become more detrimental. Many single properties have experienced permanent losses in value over time.
On the other hand, owning a portfolio of real properties that includes many property types (apartment, office, retail, self-storage, etc.) – particularly if over several geographic areas -- has rarely led to permanent loss unless excessive debt was used to purchase the properties.
This leads to a second source of losses, leverage. Many a worthwhile investment has turned into a loss for the holder because of too much debt on the asset. Leverage is a double-edged sword. It enhances returns during good times but can destroy them in down cycles. Limiting or avoiding leverage may be the single best way to avoid a permanent loss.
Owning the total U.S. stock market, despite its periodic declines, has provided enviable long-term returns, averaging roughly a 6% annualized return above inflation in every 35 year period over the past two centuries according to Jeremy Siegel's Stocks for the Long Run.
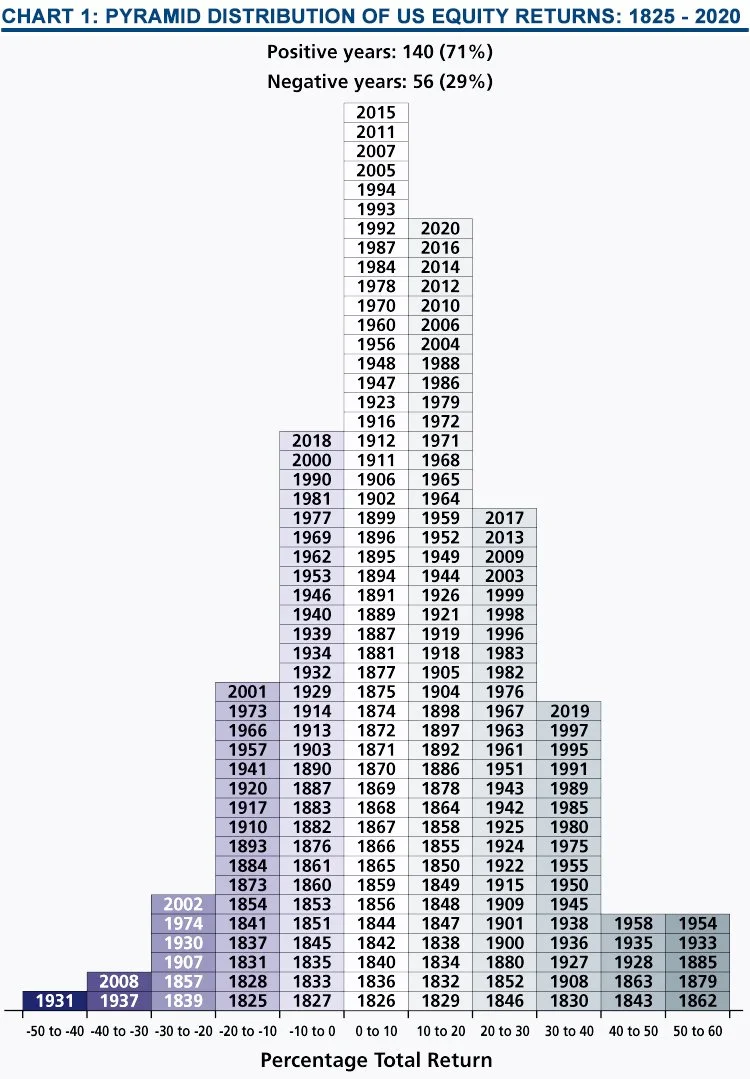
Source: The WSJ, Market Tools, Value Square Asset Mgmt, Yale University
Chart 1 illustrates the U.S. stock market’s annual returns from 1825 through 2020. The annual returns are categorized by ten percent increments. For example, on the bottom left of the chart is the year 1931 over the -50% to -40%. This indicates that it is the only year with an annual decline greater than 40%. There are only two additional years (out of 196) that had declines greater than 30%. The year 2008 was one of them which shows how brutal the Financial Crisis was while one was in it.
If the total U.S. stock market ends 2022 where it was at its recent low, down 23%, it would be only the seventh year out of the 196 in the -20% to -30% category.
As shown on the chart, the market has provided a positive return in seven out of every ten years, and a negative return the other three. Almost the same percentage has held true in this century through 2020. There have been five down years and sixteen up years.
Taking it one step further, portfolios built around professionally researched asset allocations can be tailored to limit the degree of decline during major bear markets.
Asset allocation makes further use of diversification by using multiple asset classes. This is what our Investment Policies have accomplished in the real world of investing for 32 years.
One final way of looking at market declines is through the path of travel. The total U.S. stock market was virtually the same price in late November of 2020 as it was at the end of June 2022. However, this price was at an all-time high back then. From November 2020, the market continued to climb reaching its cycle high at the very beginning of this year. Since then it has retraced those additional gains back to the November 2020 price.
Everyone was more than delighted with today’s price just a year and-a- half ago. If the market had declined first (after that November 2020 high), and then recovered back to today’s price, most investors would be ecstatic today…and yet it is the same price. The difference is only how we got here. For our perception, the path of travel is often more important than the price.